Streamlit_Apps
My Python streamlit project! Click Here!
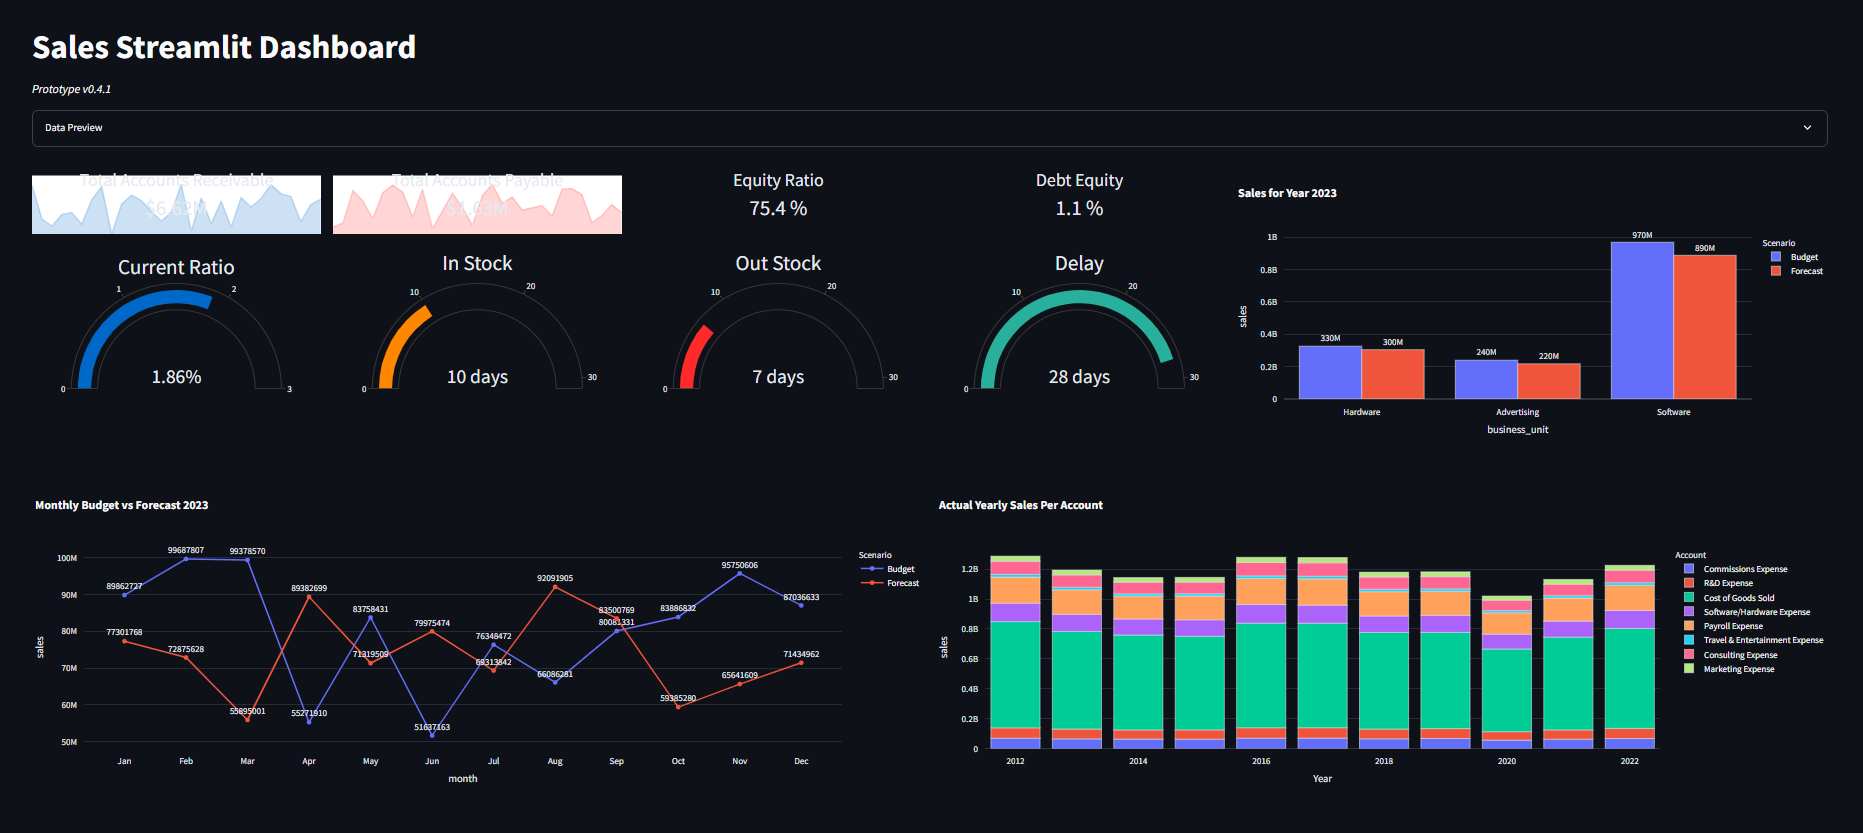
Sales Streamlit Dashboard
A sleek, interactive sales dashboard built using Streamlit and Plotly, displaying KPIs and analytics from finance and operations.
Features
- Monthly Budget vs Forecast Comparison (2023)
- Yearly Sales per Account breakdown
- Key Financial Metrics (Current Ratio, Equity, Debt, Stock Delay)
- Toggleable Data Preview
- Visualized with gauges and bar/line charts
Preview
Tech Stack
- Python
- Streamlit
- Plotly
- Pandas
- Numpy