Pyhton_EDA_Logistics_Shipments_Return
A comprehensive analysis of shipment delays in logistics, helping businesses identify trends, mitigate risks, and optimize delivery efficiency. Using Python, Pandas, Seaborn, and Scikit-learn.
View Complete Jupyter Notebook!
Monthly Sales vs Return Request Trend
Analyzed monthly revenue and return request trends from September 2024 to May 2025 to identify seasonal patterns and correlations.
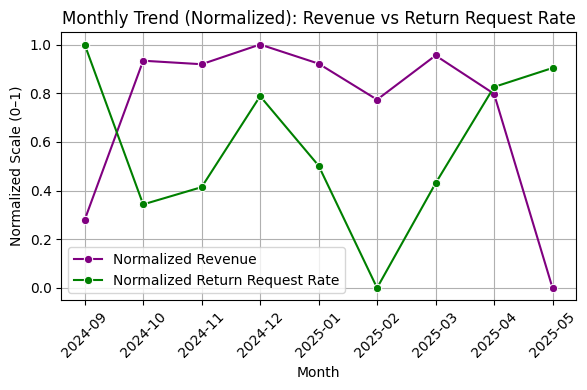
The graph tracks normalized revenue and return request rate from September 2024 to May 2025, highlighting fluctuations and potential correlations between sales and returns over time. Revenue peaked in December 2024 before declining, while return request rates varied, trending upward in May 2025.
Return Rate by Product Category
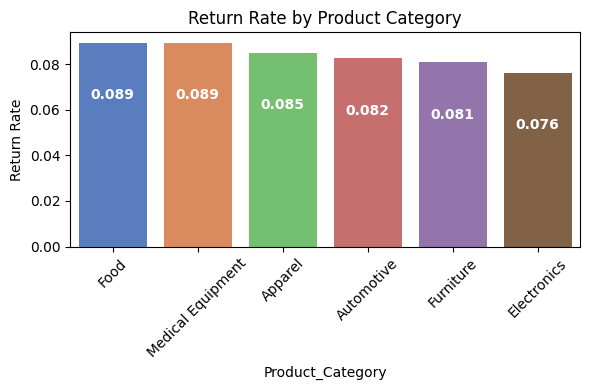
Evaluated return rates across product categories to identify high-risk segments.
Return Reason Distribution
Categorized and visualized reasons for product returns to detect operational issues.
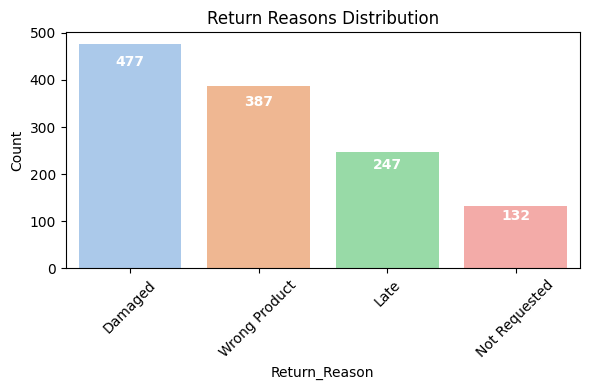
Return Rate by Product Category shows Food and Medical Equipment have the highest returns, likely due to perishability and compliance issues. Return Reasons Distribution reveals “Damaged” and “Wrong Product” as leading causes, pointing to potential improvements in packaging and order accuracy.
Correlation Matrix (numerical fields)
Calculated correlation between numerical variables to identify key relationships affecting cost and customer satisfaction.
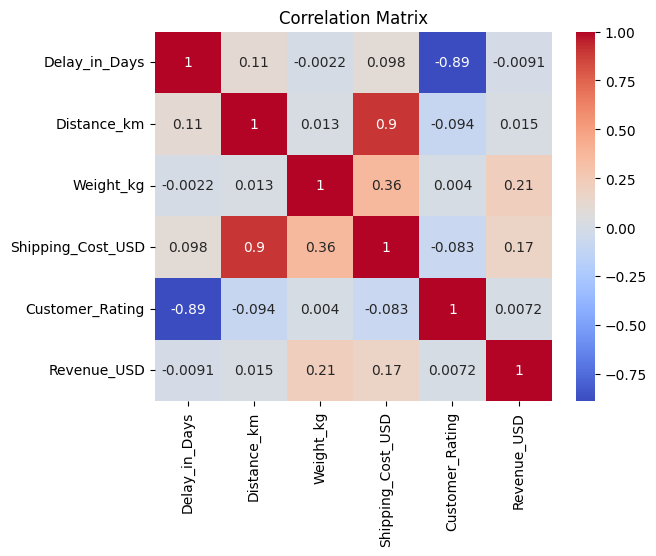
Strong Positive Correlations: Distance & Shipping Cost (0.9), Weight & Shipping Cost (0.36). (As Expected) Strong Negative Correlations: Delay & Customer Rating (-0.89), Distance & Customer Rating (-0.094). Insights suggest that longer distances and higher weight drive costs, while delays significantly reduce customer satisfaction, offering critical areas for optimization.
Distribution of Shipment Delays
Assessed the frequency and distribution of shipment delays.
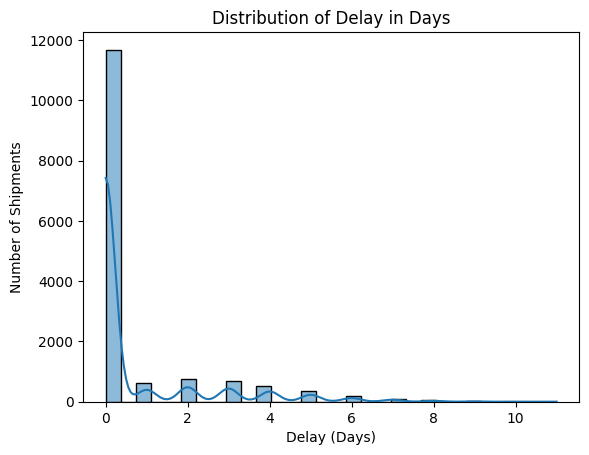
The shipment delay distribution shows that most shipments experience zero delay, while fewer face delays up to 10 days, forming a long-tail pattern. This insight helps in identifying potential areas for logistics improvements and delivery efficiency optimization.
Shipment Mode vs SLA Breach
Cross-compared shipment mode with service-level agreement (SLA) breaches to uncover reliability issues.
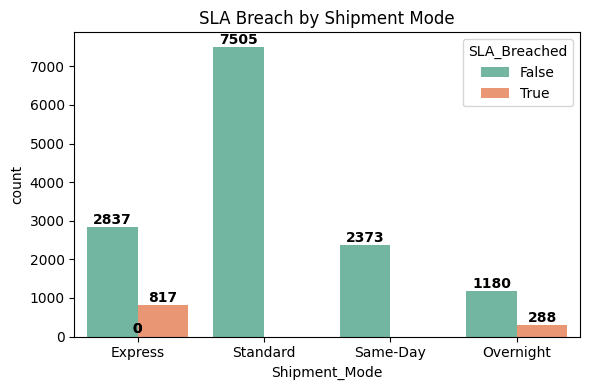
Standard and Overnight shipment modes experience breaches, while Express and Same-Day shipments have zero breaches. This indicates potential optimization needs for Standard and Overnight logistics, improving reliability and customer satisfaction.
Shipment Delay vs Reason
Identified the most common reasons for shipment delays to guide mitigation strategies.
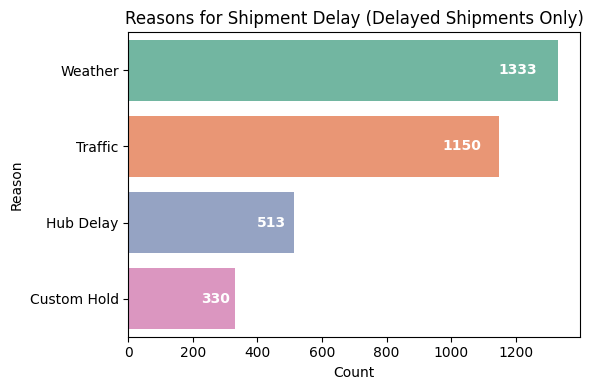
Weather as the leading cause of delays (1333 cases), followed by Traffic (1150), Hub Delay (513), and Custom Hold (330). These insights highlight key areas for logistics optimization, improving delivery efficiency and minimizing disruptions.
Regional Delays Comparison
Compared delay trends across regions to detect geographic performance gaps.
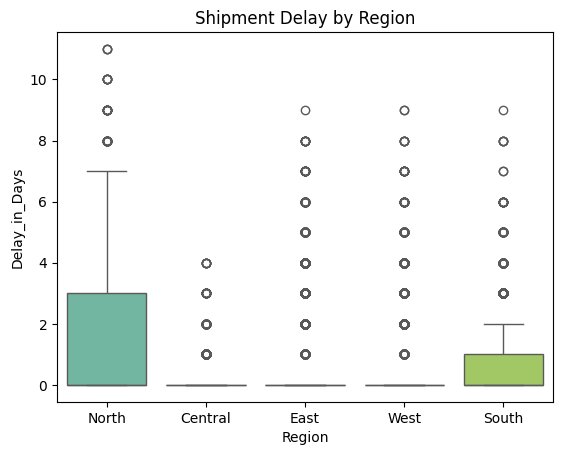
North region experiences the highest median delay and widest variability, while the South region has the lowest delays. Central, East, and West regions show minimal delays, with most shipments arriving on time. These insights highlight potential logistical challenges in the North, suggesting opportunities for route optimization and improved efficiency
Group by Customer Rating by Product Category
Analyzed customer satisfaction by product category to evaluate quality and experience.
Categories with higher ratings likely offer better quality and reliability, while lower-rated categories may have issues related to product quality or service experience. These insights can help refine inventory management, improve customer service strategies, and enhance product offerings for a better overall experience.
Calculate Average Rating per Category
Calculated and visualized average customer ratings per product category.
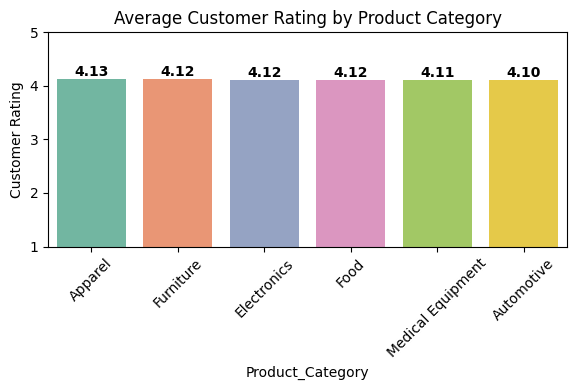
Apparel (4.13) has the highest rating, followed closely by Furniture, Electronics, and Food (4.12 each). Medical Equipment (4.11) and Automotive (4.10) rank slightly lower, but all categories maintain strong overall ratings. These insights indicate consistent customer satisfaction across categories, with potential for further improvement in lower-rated segments.
Return Requests vs Delays
Examined the impact of shipment delays on product return requests using box plots.
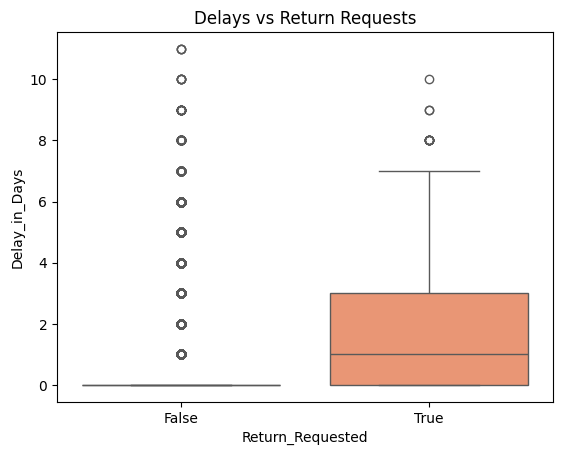
The box plot shows the relationship between shipment delays and return requests:
- No Return Requested → Most shipments have zero delay, with a few outliers reaching up to 11 days.
- Return Requested → Delays are more frequent, with a median of ~2 days, and outliers extending up to 9 days. This suggests that shipments with return requests tend to experience longer delays, possibly due to handling or resolution processes.
Shipping Cost by Product Category
Compared average shipping costs by category to identify expensive logistics areas.
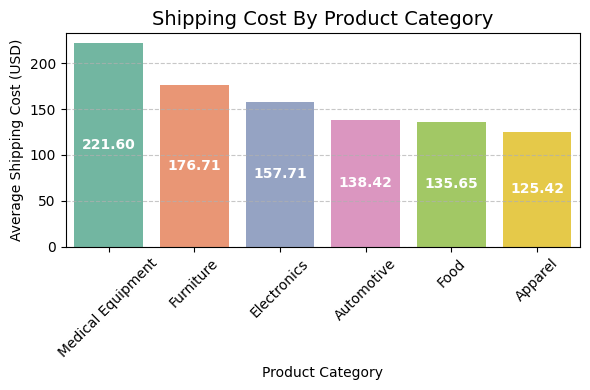
Medical Equipment ($221.60) incurs the highest shipping cost, followed by Furniture ($176.71) and Electronics ($157.71). Apparel ($125.42) has the lowest shipping cost, indicating lighter weight and easier handling. These insights can help optimize logistics strategies and cost efficiency for different product categories.
Profit by Product Category & Region
Analyzed net profit per category to guide pricing and inventory decisions.
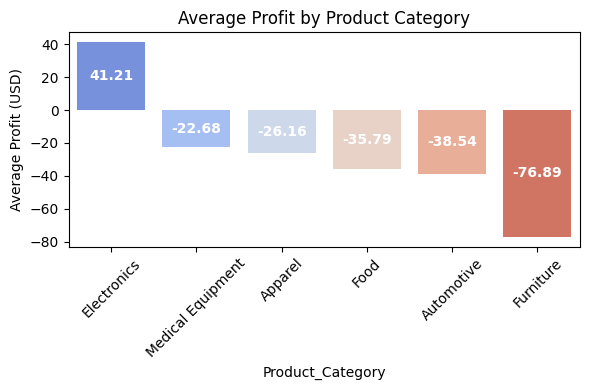
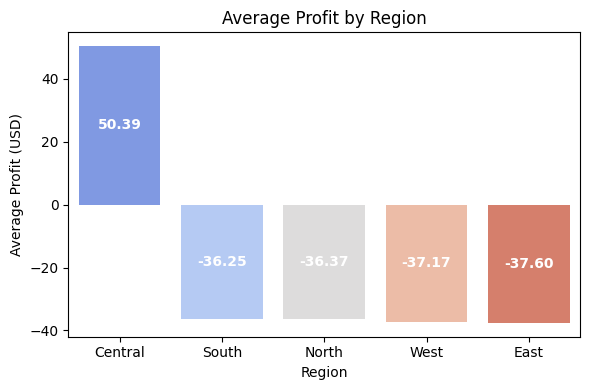
Electronics as the only profitable category ($41.21), while Furniture (-$76.89) has the highest losses, followed by Automotive (-$38.54) and Food (-$35.79). These insights highlight areas for cost optimization, pricing adjustments, and strategic improvements to minimize losses and enhance profitability. Central region (50.39 USD) is the only profitable area, while South (-36.25 USD), North (-36.37 USD), West (-37.17 USD), and East (-37.60 USD) all report losses. These insights highlight a need for regional strategy adjustments to improve profitability across underperforming regions.
Customer Segmentation
- Performed RFM (Recency, Frequency, Monetary) analysis to segment customers based on behavioral data.
- Integrated Polarity Scores from customer feedback to enrich segmentation with sentiment insights.
- Applied clustering techniques to group customers into actionable segments such as Best, Loyal, At Risk, and Lost.
- Enabled targeted retention strategies and personalized engagement plans based on segment profiles.
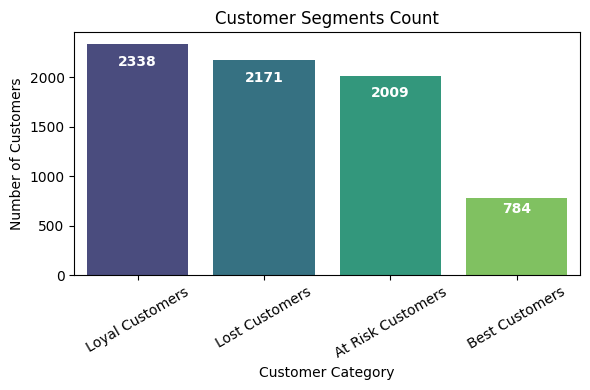
This bar chart categorizes customers into Loyal, Lost, At Risk, and Best Customers, providing a snapshot of customer retention and engagement. To deepen the analysis, you might:
- Track trends over time: See if the number of lost or at-risk customers is increasing and identify patterns.
- Segment further: Are Best Customers primarily returning users? Are At Risk Customers showing a decline in purchases or engagement?
- Explore influencing factors: What differentiates your Best Customers from At Risk ones? Are there specific products, service interactions, or promotions that impact retention?