PowerBI_Logistic_Shipments_Delay_Insights
This Power BI project analyzes 15,000+ shipment records to uncover delay trends, return patterns, and customer experience insights across multiple regions, carriers, and shipment modes. It includes KPI tracking, delay reasons, SLA breach rates, return analysis, and cost-to-revenue correlation.
Motivation
Logistics operations face rising challenges with on-time delivery, customer satisfaction, and return management. This project was initiated to uncover patterns in shipment delays, customer feedback, SLA breaches, and returns to optimize operational efficiency and enhance customer experience.
Dataset
The dataset consisted of 15,000 shipment records across multiple regions and carriers, with the following key attributes:
Shipment details: Order_Date, Delivery_Date, Carrier, Shipment_Mode, Product_Category
Performance metrics: Delay_in_Days, Delayed, SLA_Breached, Shipping_Cost_USD, Revenue_USD
Customer experience: Customer_Rating, Return_Requested, Return_Reason
Geographic: Region, City, Warehouse_ID
Tools Used
Power BI Desktop – For dashboard design and DAX-based analysis
Power Query – For data transformation and cleaning
DAX – To calculate KPIs like average delay, return rate, SLA breach rate, and shipping-revenue correlation
Python - For EDA &tTo segment Customers (RFM)
Outcome
Key KPIs and visual insights derived:
- 15K Total Shipments, $2M Revenue, Avg Delay: 0.7 days
- 22.2% of shipments were delayed, with Weather and Traffic being major reasons
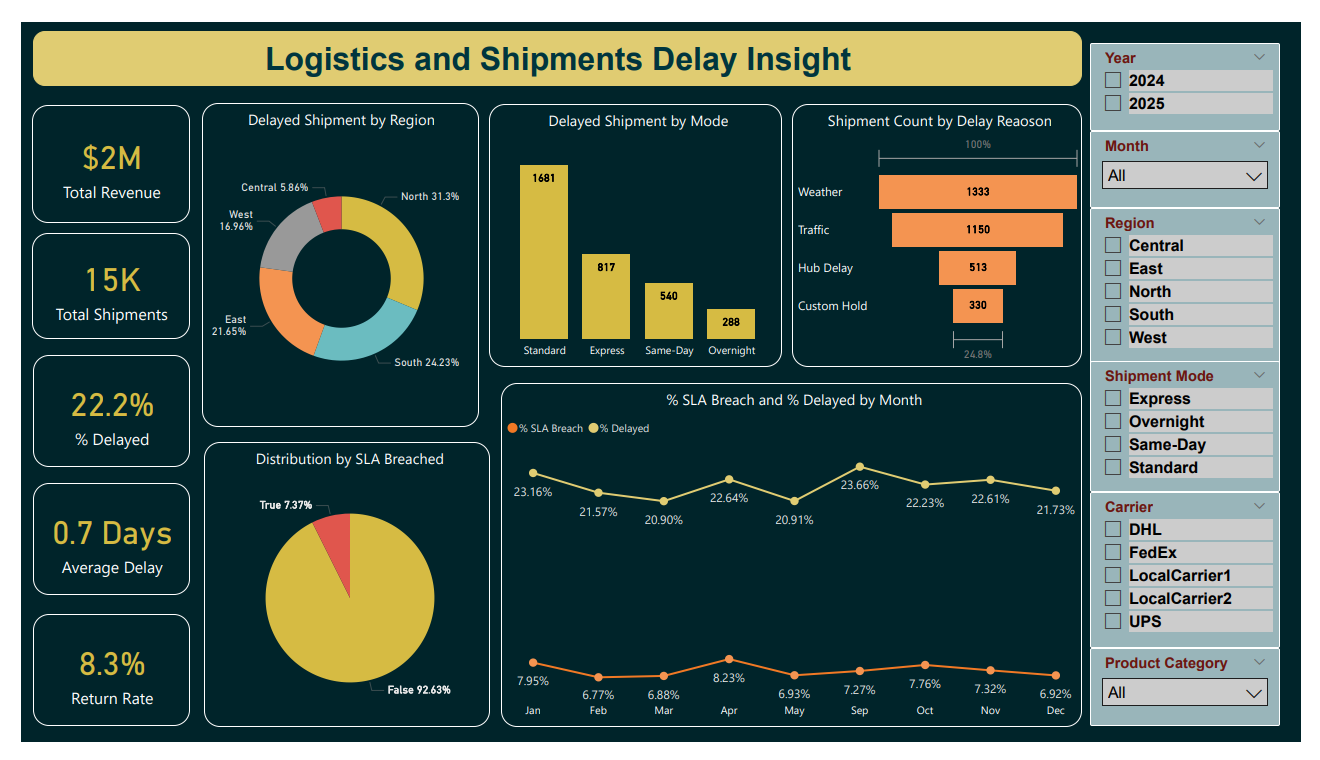
- SLA Breach Rate: 7.37% — mostly concentrated in Standard and Express modes
- Avg Shipping Cost: $154.43 USD
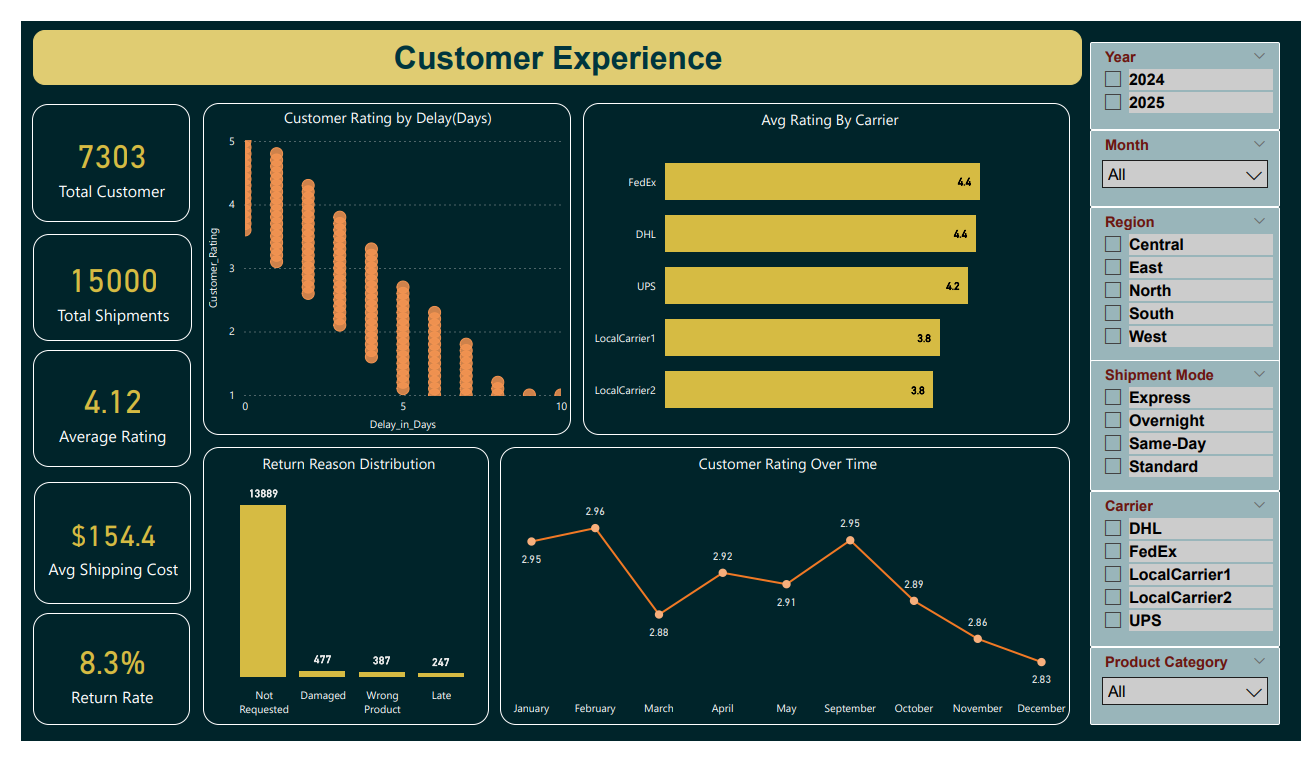
- Return Rate: 8.3% — driven largely by “Damaged” and “Wrong Product” issues
- Delay concentration by region: North (31.3%), South (24.23%), East (21.65%)
- Customer Rating drops with increased delays — carriers like LocalCarrier1 and LocalCarrier2 rated lowest
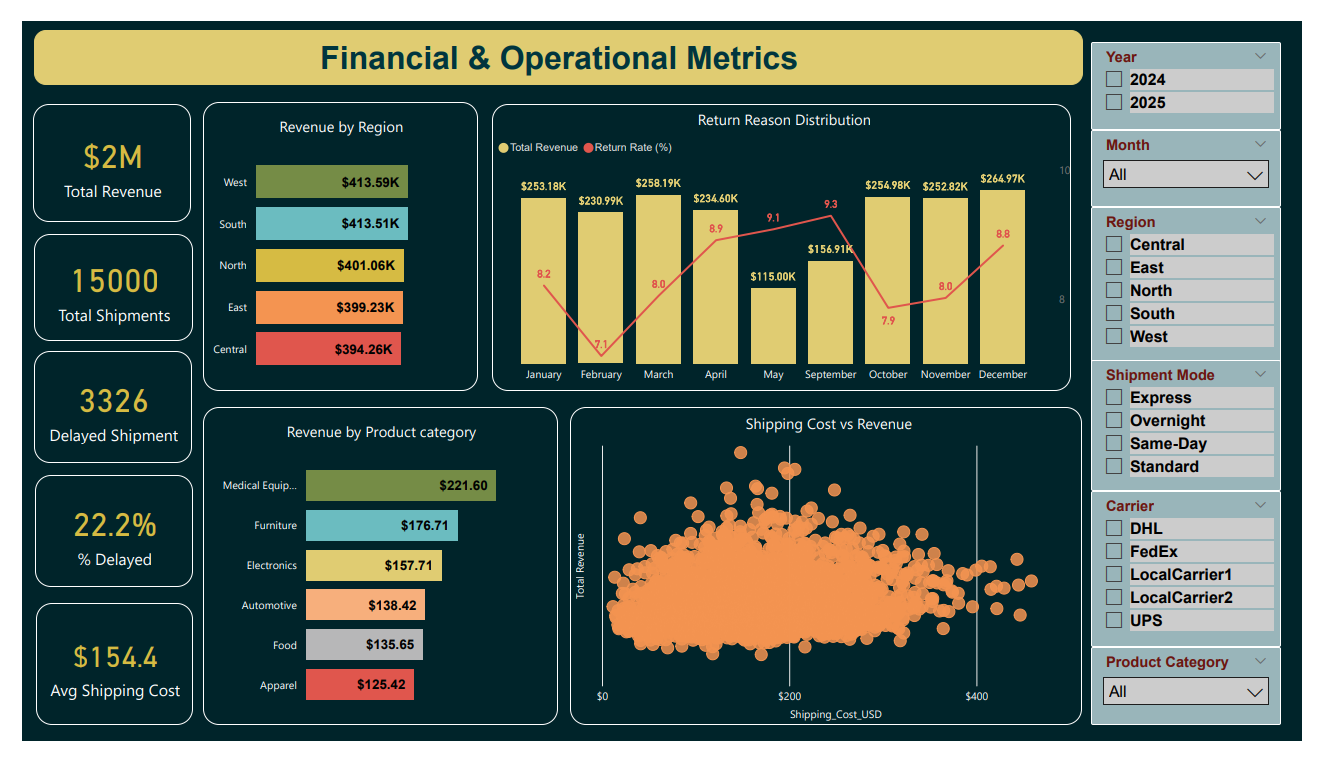
- Shipping Cost vs Revenue scatter plot with delay indicators highlighted cost inefficiencies on delayed shipments
Conclusion
This Power BI dashboard provided actionable insights that helped stakeholders:
Identify regional and carrier-level delay hotspots
Prioritize shipment modes for SLA compliance
Correlate shipping cost and delay with customer satisfaction
Monitor return trends and drive quality control for high-return categories like Apparel and Electronics
“The dashboard brought transparency to our logistics performance like never before. We’ve already acted on delay patterns and seen a 12% improvement in delivery time in Q1. The visuals are intuitive, and the story is data-driven and client-ready.” — Client feedback