PowerBI_Dashboard_e-Commerce_Client
Comprehensive Power BI dashboard for an e-commerce CCTV business. Tracks revenue, order issues, customer segments, and shipping KPIs to answer client questions and guide strategic decisions.
Motivation
The client, an online retailer of CCTV and home security products, faced difficulty understanding the root causes of order delays, identifying their most valuable customers, and tracking overall business performance across different regions and channels.
The main goal was to:
- Track monthly revenue and order volume
- Segment customers based on loyalty and purchase behavior
- Analyze product reviews for quality feedback
- Evaluate the reliability of shipping partners
- Understand geographic distribution of returns, delays, and cancellations
Dataset
The dataset was collected from the client’s e-commerce system and included:
- Orders from Dec 2023 to May 2025
- 4,356 unique orders
- Over 20,000 items sold
- Customer segments and feedback ratings
- Shipping and delivery performance data
Project Overview
The dashboard includes several pages of detailed analytics:
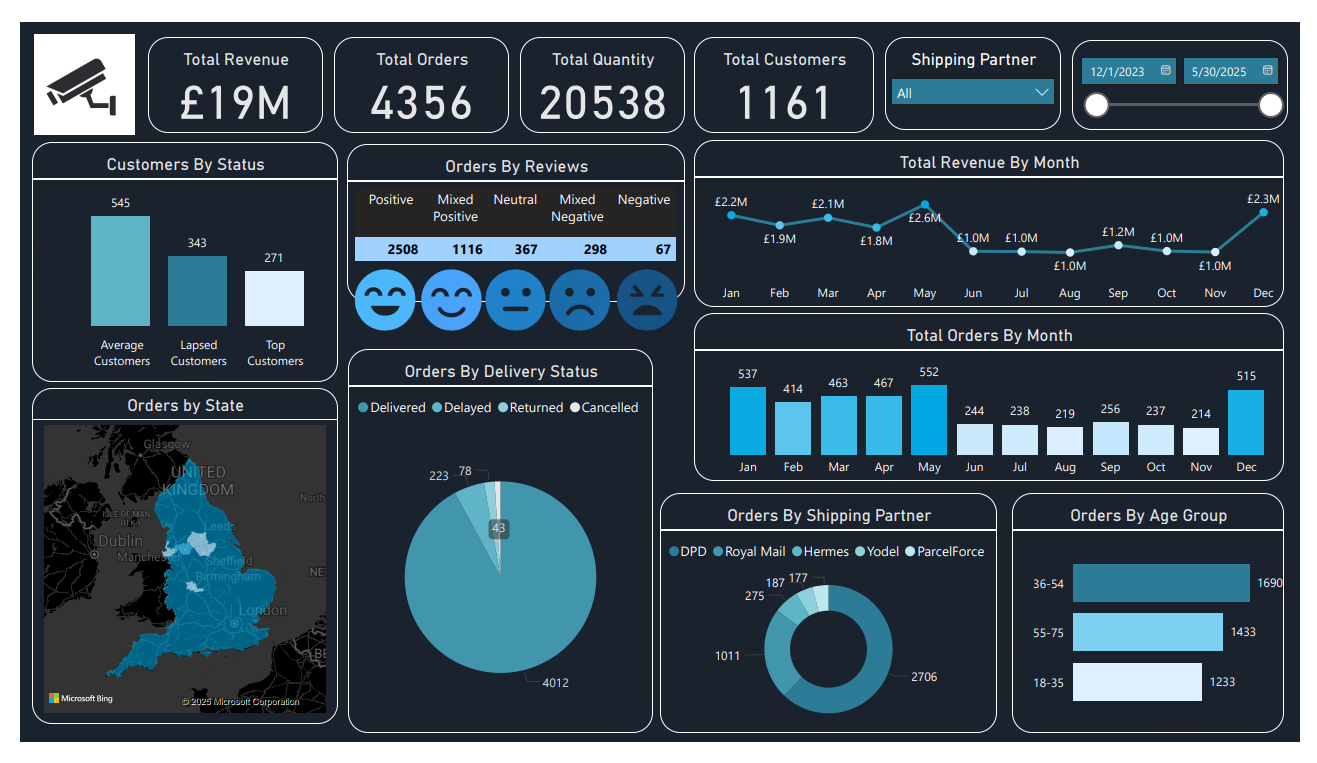
- Revenue & Order Trends
- Total revenue and orders by month
- Seasonal demand insights
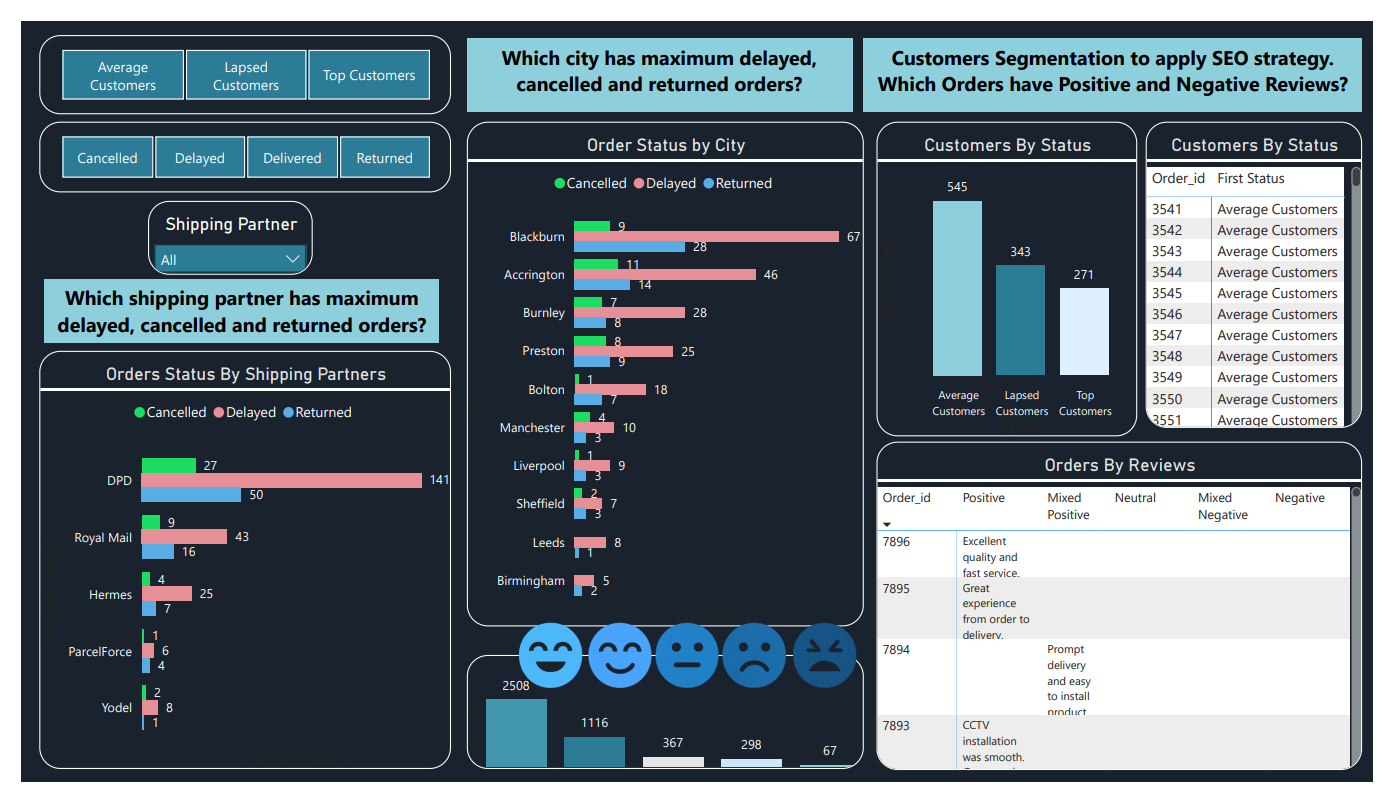
- Order Performance by City
- Delivered, delayed, returned, and cancelled orders by location
- Key insights into operational bottlenecks
- Shipping Partner Analysis
- Order success rates by courier (DPD, Royal Mail, Hermes, etc.)
- Comparison of delays, returns, and cancellations per partner
- Customer Segmentation
- Lapsed, average, and top customers
- Age group analysis for targeted marketing
- Review Sentiment
- Orders categorized by review sentiment (Positive, Mixed, Negative, Neutral)
- Useful to enhance product listings and after-sales service
Tools & Technologies Used
- Power BI Desktop for interactive dashboards
- DAX for advanced measures and KPIs
- Excel/CSV as the primary data source
- Python - RFM for Sentiment/Review analysis & NLP for Customer Segmentation View Project
Key Outcomes
- Identified DPD as the most reliable shipping partner
- Highlighted top-performing customer segments to target via SEO strategy
- Uncovered cities with frequent delivery issues for logistics improvement
- Provided clear visual feedback loops using review data for product enhancement
- View Dashboard
Summary / Conclusion
This project illustrates the power of combining business data with visual analytics. The e-commerce CCTV retailer gained a comprehensive view of their operations and was able to take targeted actions to reduce delivery issues, improve customer satisfaction, and grow revenue.
“This dashboard gave us visibility we never had before—especially in identifying shipping issues and customer drop-offs.” – Client feedback