PowerBI_Dashboard_Real_Estate
A data-driven Power BI dashboard project analyzing real estate sales, agent productivity, gross profit trends, and regional performance. View Project!
Motivation
In the competitive real estate market, having visibility into agent performance, regional profitability, and sales funnel efficiency is vital for strategic decisions. The client, a real estate agency operating in multiple U.S. cities, sought a centralized Business Intelligence solution to:
- Monitor KPIs across sales stages
- Identify high-performing agents and regions
- Compare year-over-year growth
- Optimize revenue streams and agent engagement
Dataset
The dataset consisted of deal-level records from Feb 2024 to May 2025, including:
- Agent names and regions
- Lead conversion funnel stages (Leads → Inquiry → Offers → Deals Closed)
- Revenue and Gross Profit per deal
- Monthly sales figures and deal timelines
- Regional segmentation: New York, Chicago, San Francisco, Miami, Austin
Project Overview
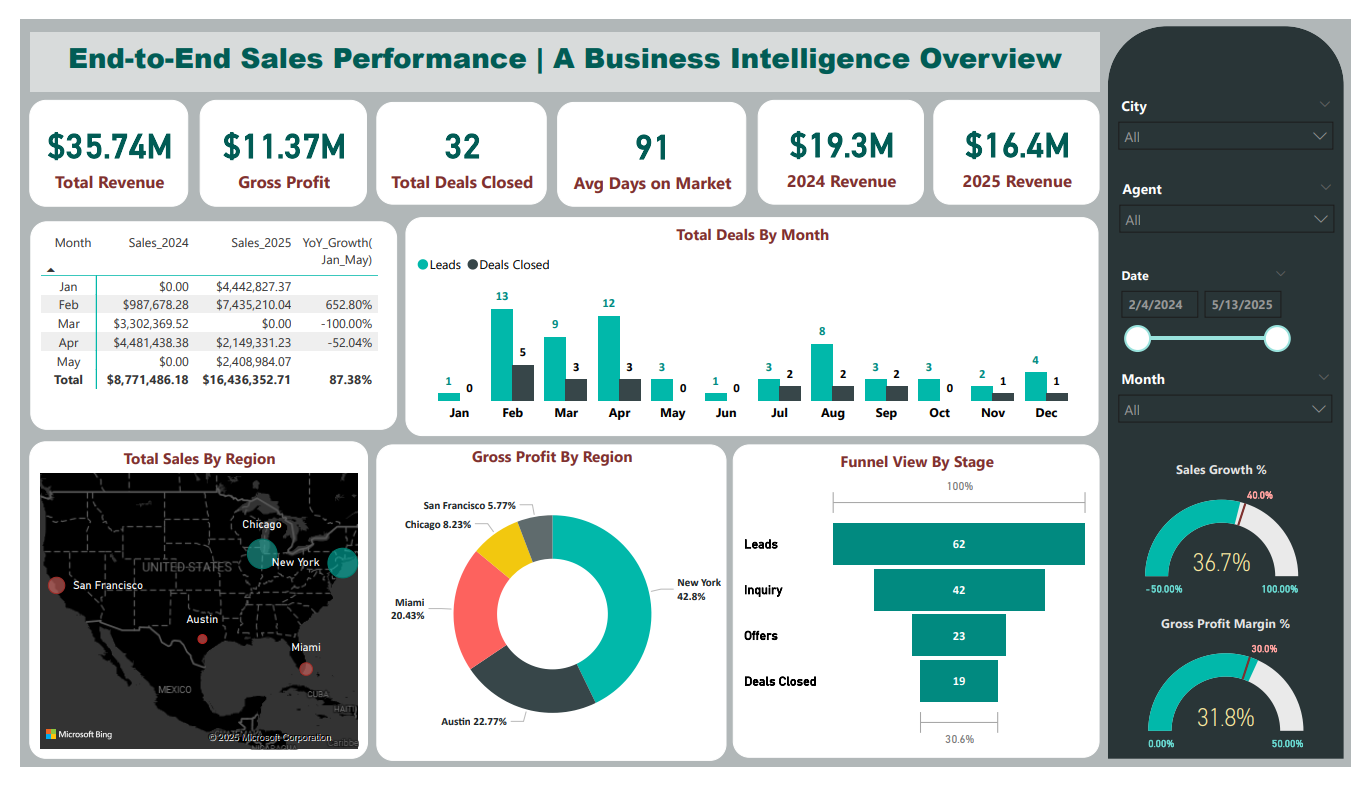
This Power BI dashboard delivers a comprehensive view of end-to-end sales performance, enabling real-time insights into:
- Total Revenue: $35.74M across all cities and agents
- Gross Profit: $11.37M with a margin of 31.8%
- Sales Funnel: Lead-to-close ratio visualized through funnel breakdown
- YOY Growth: Sales comparison from Jan–May 2024 vs Jan–May 2025
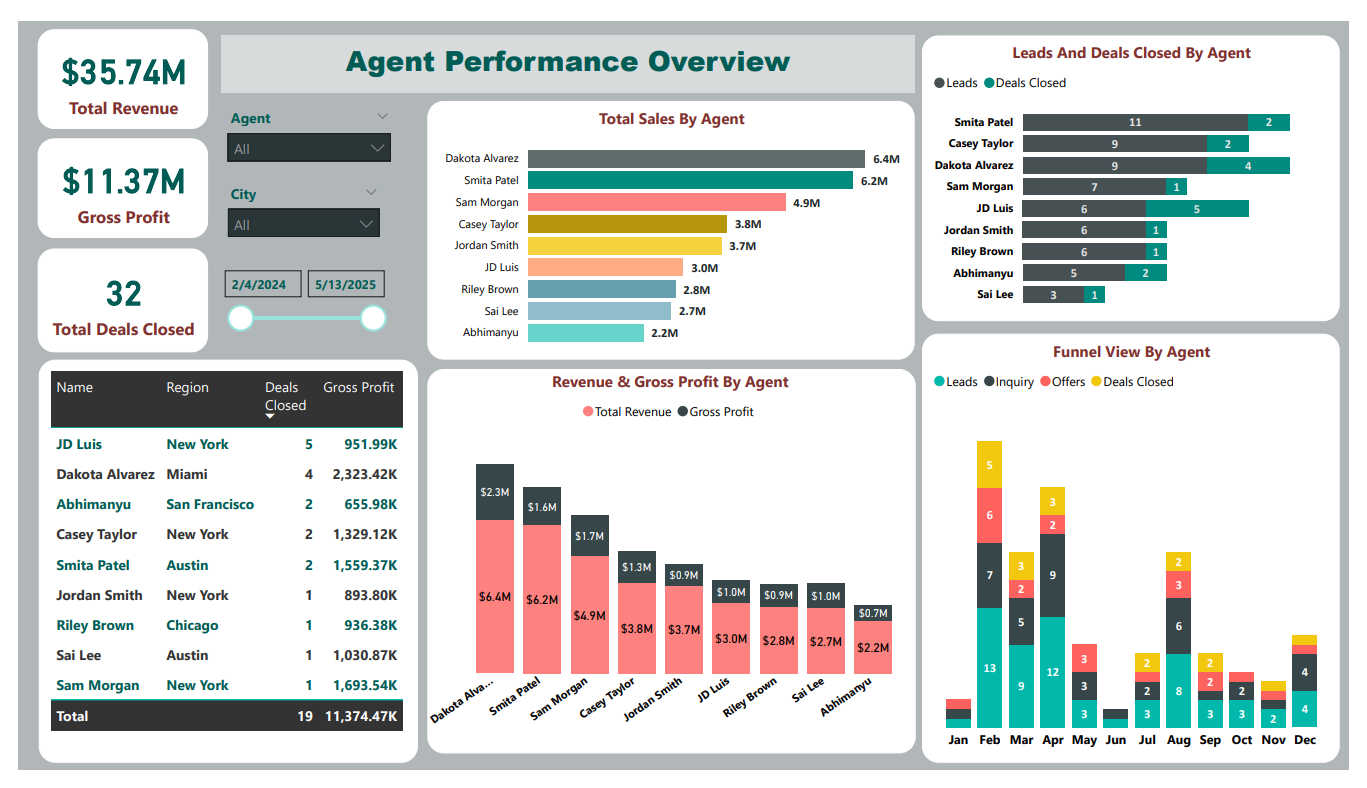
- Agent-Level Breakdown: Revenue, profit, leads, and deal closures per agent
- Region-Level Analysis: Profitability and conversion success by geography
Tools Used
- Power BI Desktop for data modeling, DAX calculations, and interactive dashboard design
- DAX (Data Analysis Expressions) for calculated measures such as Gross Profit Margin, Monthly Sales Comparison, Agent KPIs
- Microsoft Excel as the data source
- Map Visuals, Funnel Charts, Bar Charts for intuitive insight delivery
Outcome
- Improved Decision-Making: Enabled client to identify and incentivize top agents like Dakota Alvarez and Smita Patel
- Revenue Visibility: Tracked $19.3M revenue in 2024 and $16.4M in early 2025
- Agent Productivity: Revealed disparities in deal closure efficiency (e.g., JD Luis with 5 deals and $951.99K gross profit)
- Actionable Insights: Highlighted underperforming cities (e.g., San Francisco) and enabled targeted strategy shifts
Summary/Conclusion
The project successfully transformed fragmented real estate sales data into a dynamic and visual business performance report. The client can now:
- Monitor progress across the sales funnel
- Benchmark agents and regions
- Prioritize revenue-generating efforts
- React to market shifts swiftly
“This dashboard has changed how we manage our team. We can now see which agents are closing deals efficiently and where we need to focus more. It’s not just about numbers anymore—it’s about understanding the business in real time.” - Client Feedback