PowerBI_Dashboard_Healthcare_Client
Interactive Power BI dashboard developed for a private physiotherapy clinic to help the client better understand business performance, patient behavior, and insurance claim trends.
Motivation
Private individual healthcare providers often lack access to robust data visualization tools that can help streamline their operations, improve customer satisfaction, and make informed decisions. My client, a practicing physiotherapist, approached me with the goal of consolidating and visualizing their clinic’s performance metrics in an interactive and intuitive manner.
The motivation behind this project was to create a user-friendly dashboard that would allow the physiotherapist to:
- Monitor monthly revenue trends
- Track patient demographics and appointment patterns
- Evaluate employee performance
- Understand insurance claim processing outcomes
Dataset
The dataset was provided by the client and included anonymized patient records, appointment logs, revenue reports, and insurance claim data. Key features of the dataset:
- Time frame: Jan 2024 – Dec 2025
- Total records: Over 10,000 patient interactions
- Key columns: Patient age, gender, diagnosis, revenue, shift, employee name, insurance status, claim status
Project Overview
The dashboard consists of multiple report pages that provide insights into different aspects of the clinic:
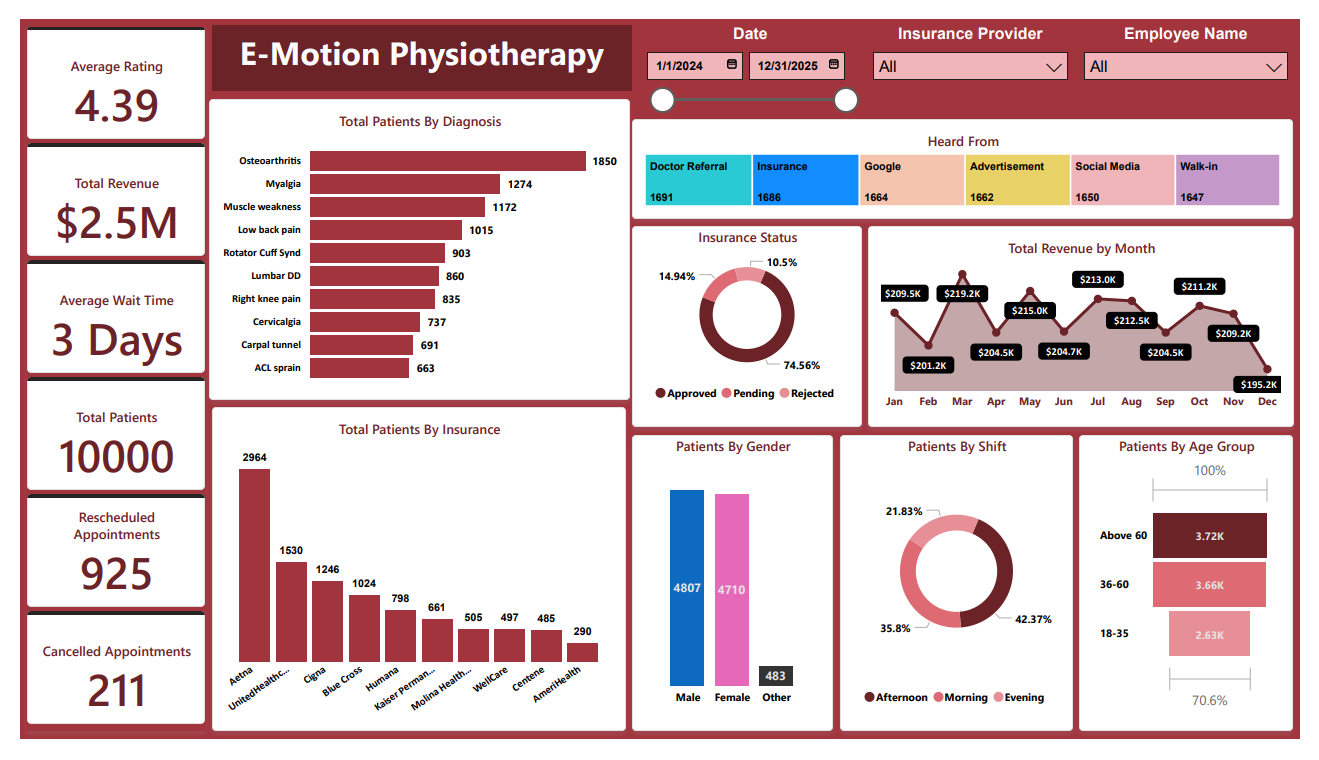
- Revenue Analysis
- Monthly revenue trends for the clinic and individual employees
- Revenue comparison by insurance providers and appointment days
- Patient Insights
- Distribution by age group, gender, and preferred shifts
- Common diagnoses (e.g., osteoarthritis, low back pain)
- Referral sources (doctor, insurance, Google, etc.)
- Appointment Metrics
- Total appointments, rescheduled, and cancelled
- Average patient wait time
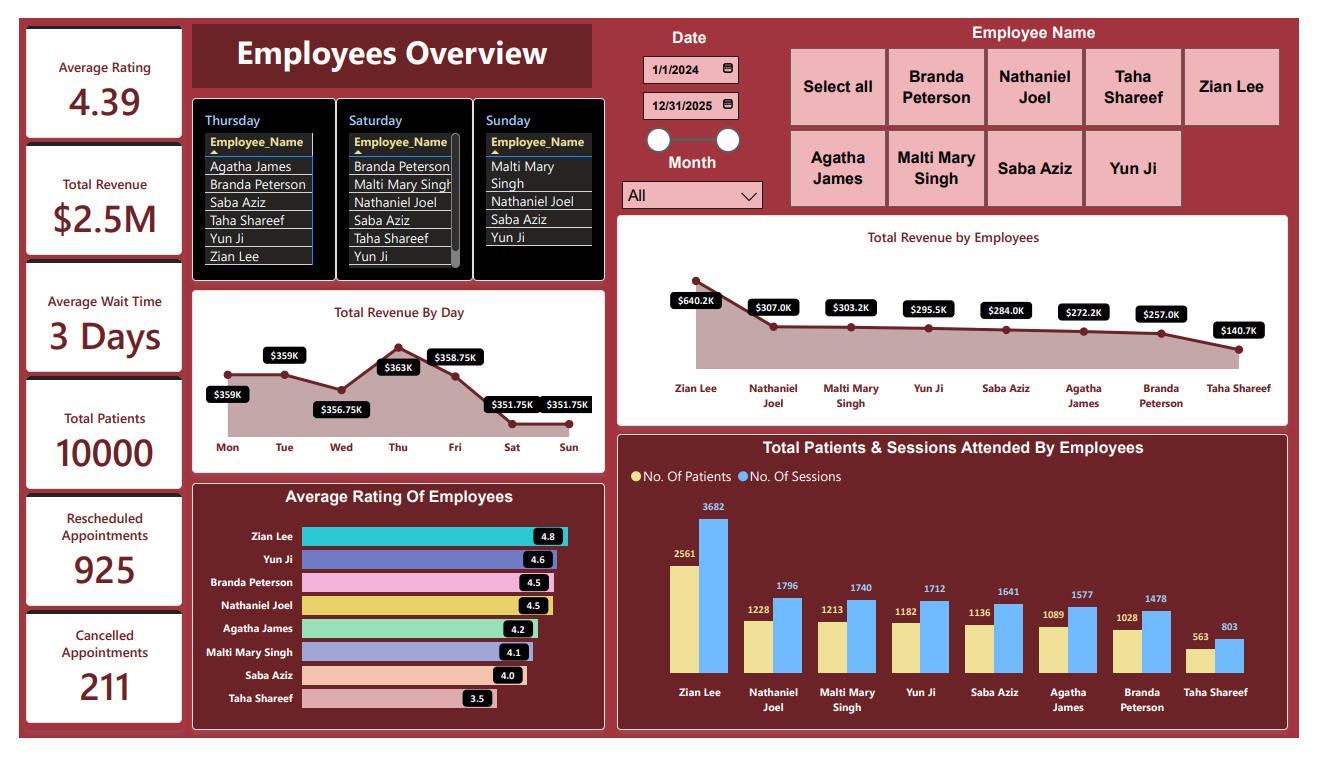
- Employee Performance
- Total patients and sessions handled by each physiotherapist
- Average rating per employee
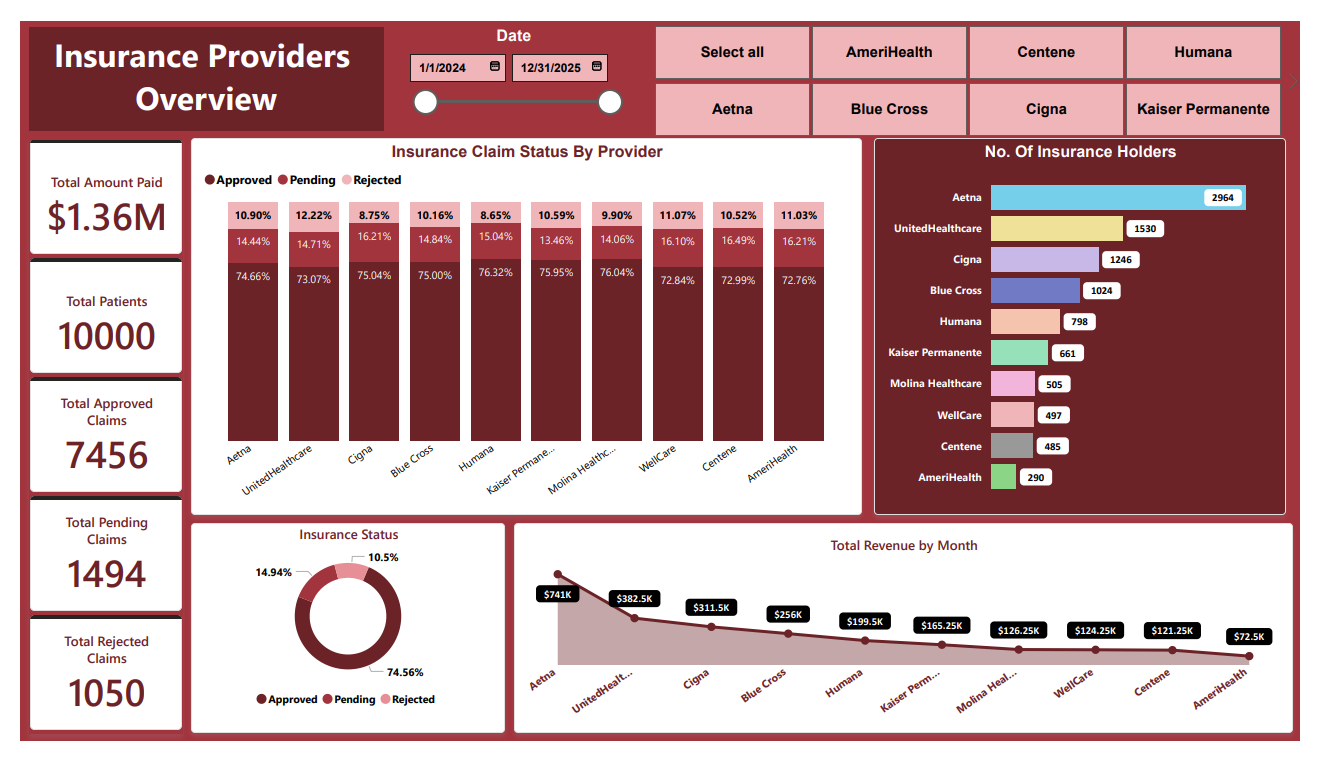
- Insurance Dashboard
- Claim approval, pending, and rejection rates by provider
- Volume and revenue contribution by insurance companies
Tools & Technologies Used
- Power BI Desktop for dashboard creation and interactivity
- DAX for calculated columns and KPIs
- Excel/CSV as the data source (processed by finding errors in ICD codes)
Key Outcomes
- Helped the client identify the most profitable insurance partners
- Optimized employee scheduling based on shift-wise patient data
- Improved focus on high-volume diagnosis types for better specialization
- Reduced rescheduling through visibility into wait time and cancellations
- View Dashboard
Summary / Conclusion
This project demonstrated how a simple yet powerful dashboard can transform decision-making for small healthcare businesses. It empowered my client, a solo physiotherapy practitioner, to gain data-driven insights that led to more efficient operations, better patient care, and increased revenue transparency.
“Now I can actually see where my income is coming from and how each employee is contributing. This has made it easier to plan and grow my clinic.” – Client feedback