Data_Analytics_All_Projects
Welcome to Data Analytics World
View All Projects
View All Dashboards
Welcome to my analytics portfolio! Below are selected real-world projects developed using Python, Power BI, Excel and Tableau for clients across e-commerce, healthcare, and business intelligence.
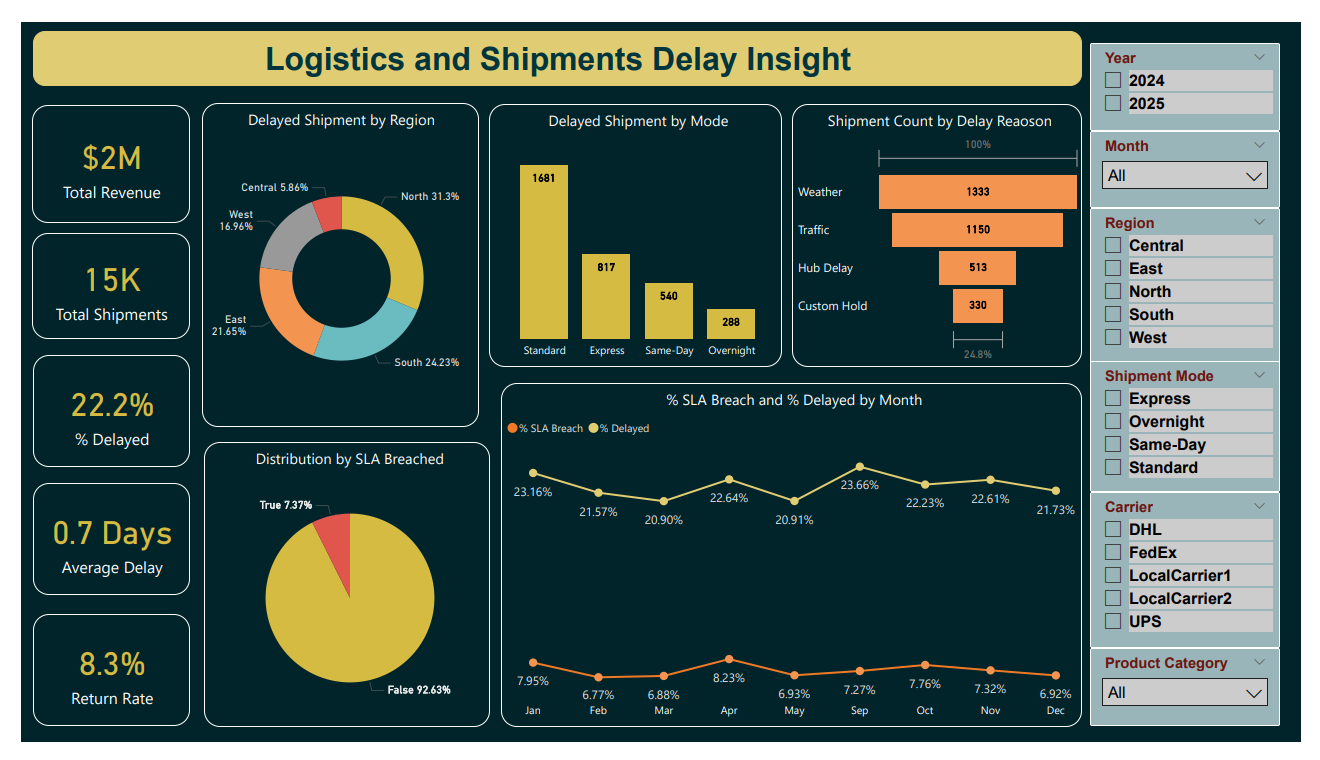
Project 1: Exploaratoy Data Analysis (EDA) for Logistics & Shipments Delay - Python
- Description: Performed EDA and delay classification on shipment records to uncover trends in logistics delays.
- Tools: Python, Pandas, Seaborn, Scikit-learn
- Impact: Identified delay-prone regions, reduced SLA breach risks, and supported delivery time optimization strategies.
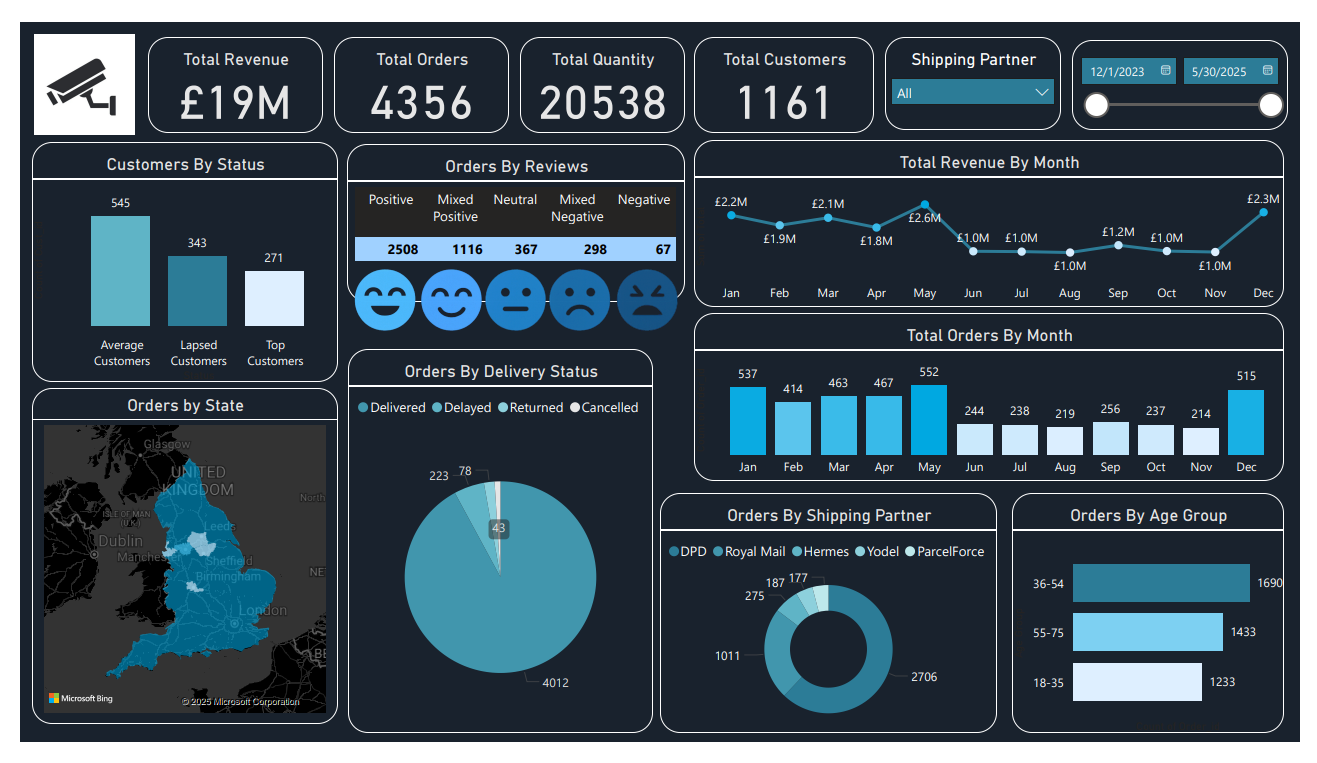
Project 2: E-commerce Data Analysis - Power BI
- Description: Tracked KPIs across sales, inventory, and customer service.
- Tools: Power BI, DAX
- Impact: Enabled leadership to make informed decisions using interactive visuals.
Project 3: Logistics, Shipments & Returns Analysis- Customer, Performance & Operation Metrics Analysis - Power BI
- Description: Analyzed 15,000+ shipments across regions, shipment modes, and carriers to uncover delay trends, SLA breach rates, returns, and cost-to-revenue insights.
- Tools: Power BI, Power Query, DAX, Python (RFM & EDA)
- Impact: Helped logistics stakeholders improve on-time delivery by 12%, reduce returns, and enhance customer satisfaction.
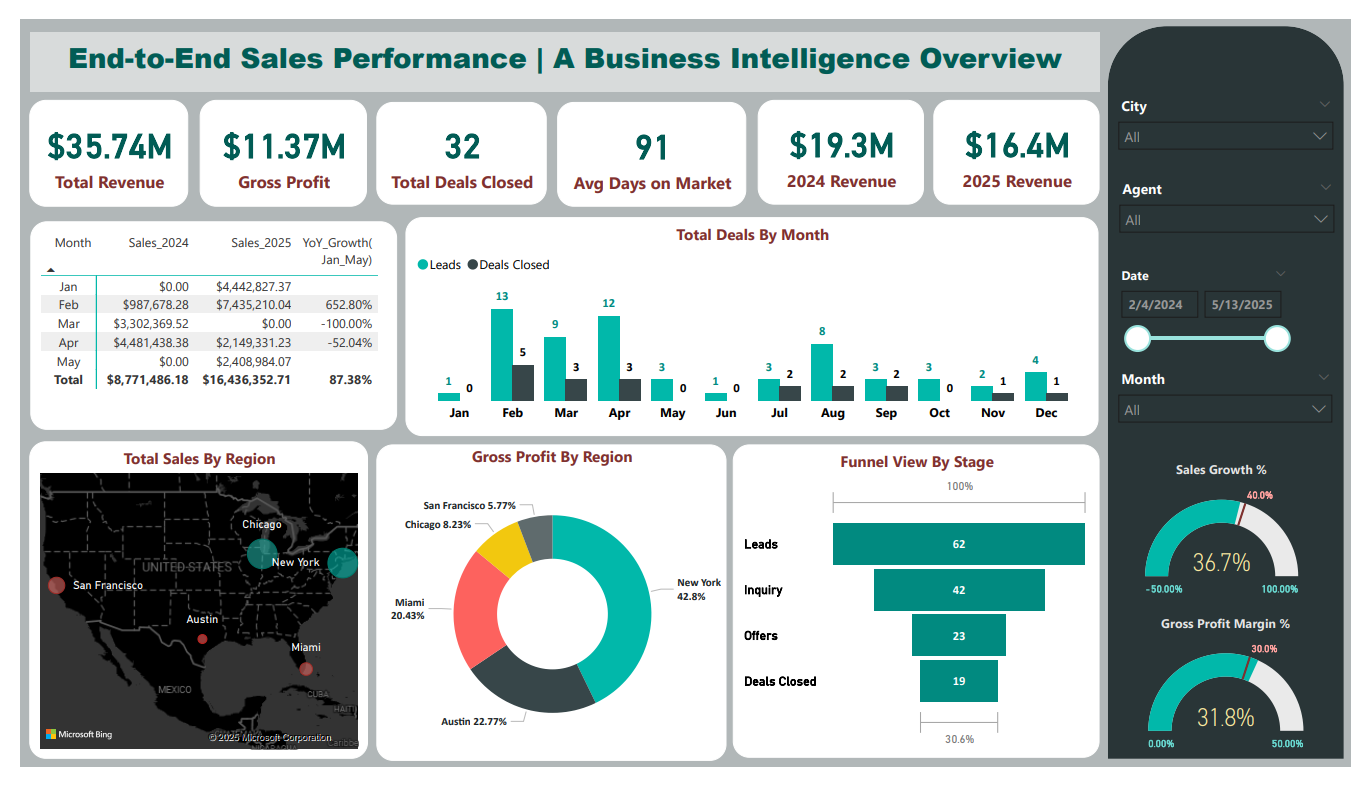
Project 4: Real Estate Sales Analysis - Power BI
- Description: Designed an end-to-end real estate sales performance dashboard to track key metrics including revenue, gross profit, agent productivity, and regional performance. The dashboard visualized the entire sales funnel—from leads to closed deals—across major U.S. cities.
- Tools: Power BI, DAX, Excel
- Impact: Empowered leadership to identify top-performing agents, monitor sales trends, and optimize regional strategies. Enhanced decision-making through real-time visual analytics and YOY growth comparison.
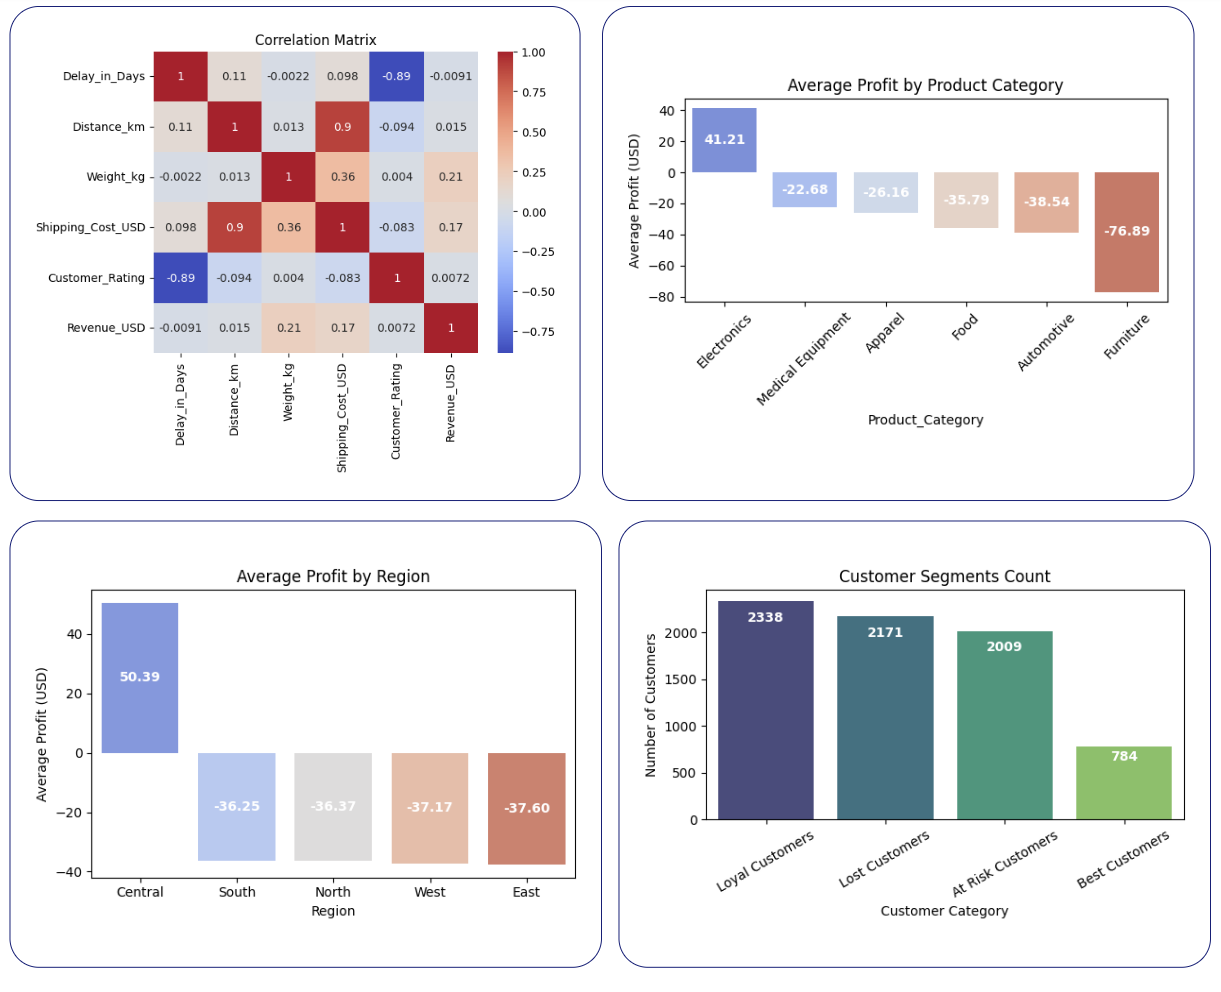
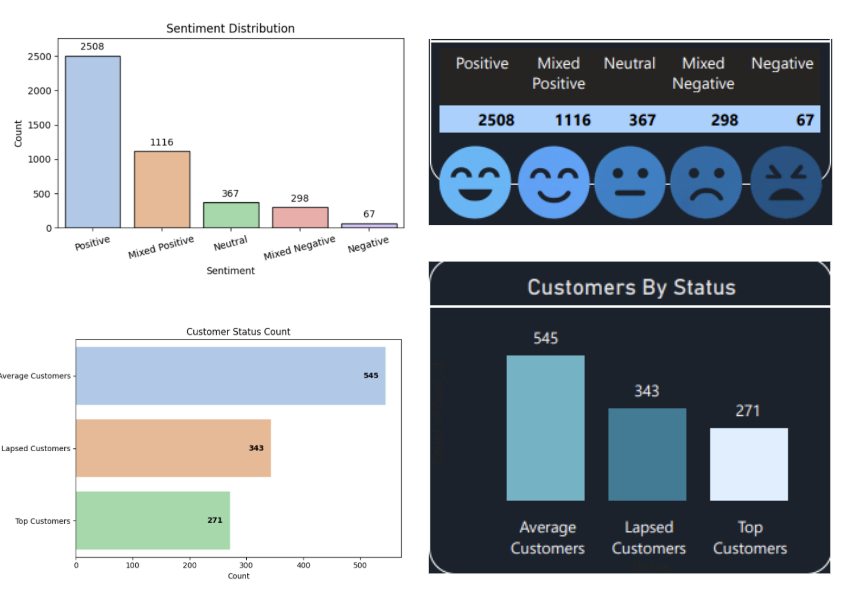
Project 5: Customer Behavior Analysis using Python (Sentiment Analysis + RFM Segmentation)
- Description: Unified sentiment classification and RFM-based segmentation to gain a 360° view of customer behavior — what they feel and how they act.
- Tools: Python, VADER, Pandas, Seaborn, Scikit-learn, Matplotlib
- Impact: Enabled personalized marketing, identified pain points in delivery, and helped re-engage lapsed customers based on emotion and transaction patterns.
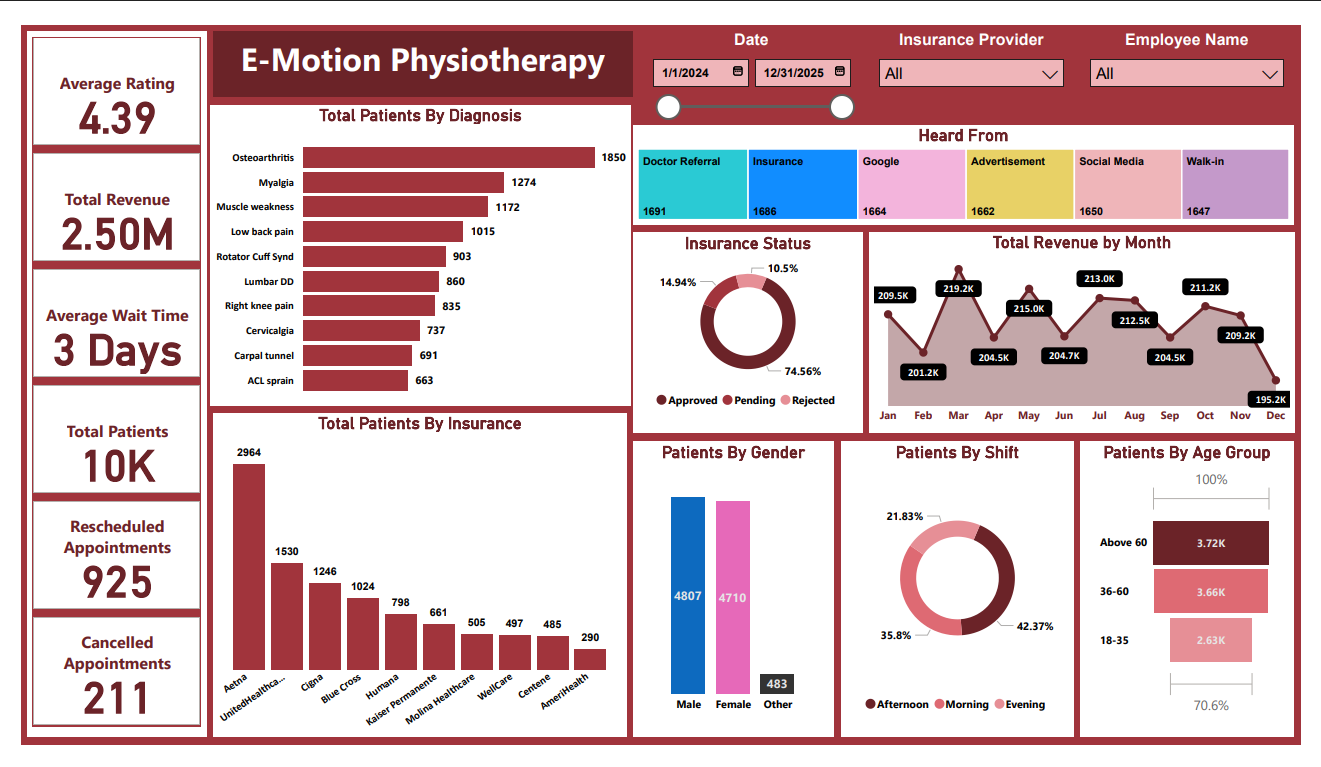
Project 6: Patient & Performance Analysis - Power BI
- Description: Developed a dashboard to monitor patient metrics, employee performance, and insurance claim trends.
- Tools: Power BI, DAX
- Impact: Streamlined healthcare operations and data-driven evaluations.
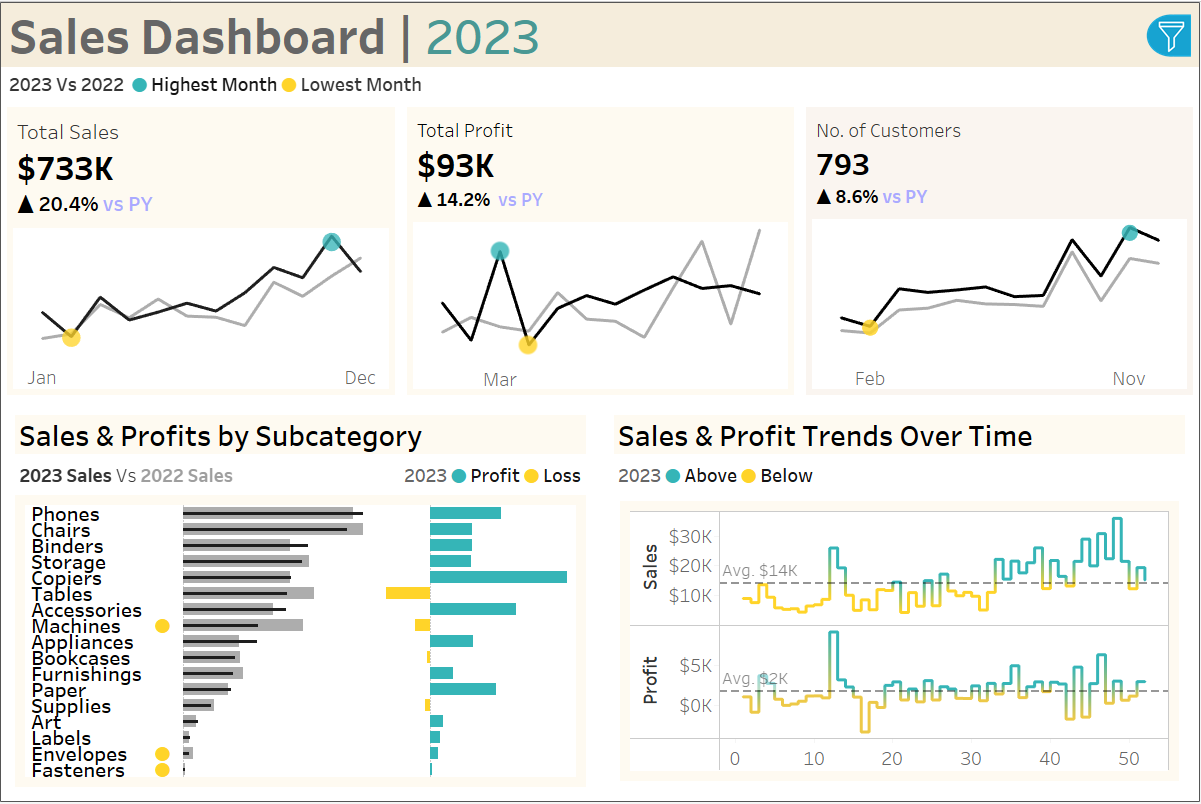
Project 7: Supply Chain Sales Analysis - Tableau
- Description: Created an interactive dashboard to compare 2023 KPIs against 2022 benchmarks.
- Tools: Tableau
- Impact: Provided insights into sales, profit, and customer growth trends for strategic planning.
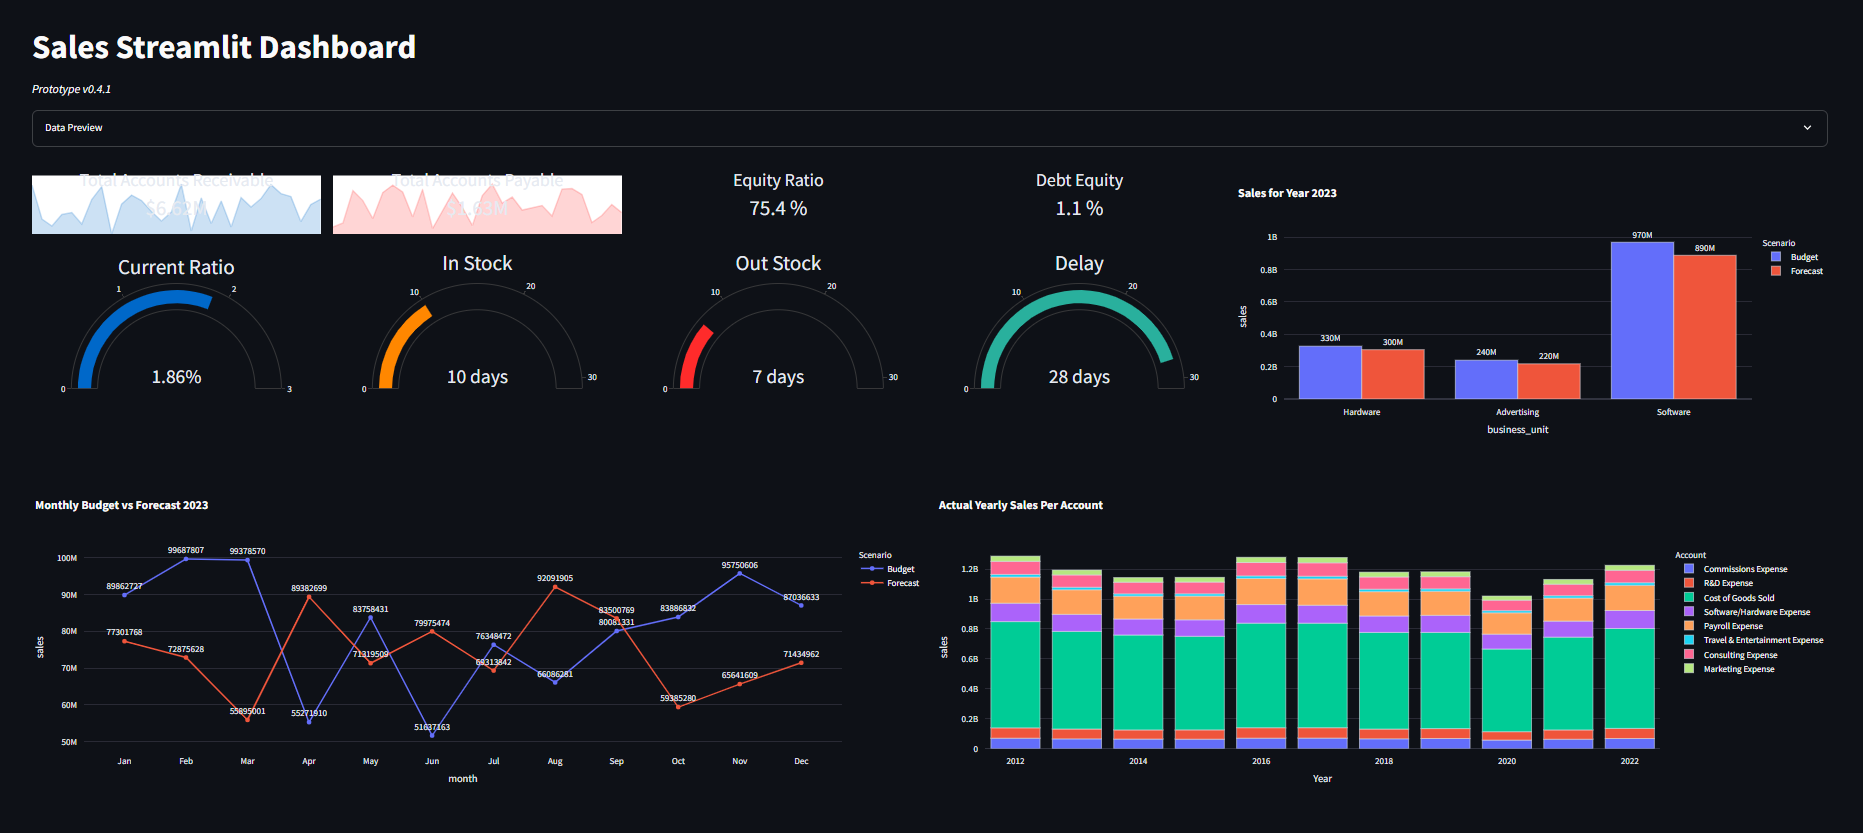
Project 8: Dynamic Streamlit App - Python
- Built a real-time interactive dashboard using Streamlit and Plotly to visualize key financial and operational KPIs.
- Integrated dynamic data preview toggles, monthly budget vs forecast charts, and yearly account-based performance breakdown.